Grownetics · open source · MIT
CEA Psychrometric
Site Evaluator.
See what your climate makes possible, what limits control, and what closing the gap could cost.
An assumption-based screen over hourly historical weather, run in your browser. Not a calibrated digital twin, equipment sizing service or manufacturer comparison. Read every result with its weather period, target band and assumptions.
Open the toolView the source
Start with the weather.
Separate airflow from air treatment.
Keep the assumptions in view.
A design day cannot tell you how often a crop band will hold across a weather year.
Cooling air and removing moisture are different tasks. A pad can lower dry-bulb temperature while adding moisture. Ventilation can dry the room while increasing heating demand. The useful question is whether the combined temperature and moisture target holds, with finite equipment capacity and the crop load included.
The current Tulsa regional example makes the distinction visible. The pad and vent baseline reaches a median joint attainment of 28.038% over 2016 to 2025. Its worst and best years reach 22.589% and 30.315%, a spread of 7.726 percentage points (pp). These are model outputs under the declared assumptions, not measured indoor conditions.
The six strategies produce two operating-cost orders across those ten years. One year, or one ranked list, is not the whole decision.
§ 02
What it answers
Three site questions
Q1What can the outside air do?
Weather-side cooling, drying and pad opportunities, separate from simulated indoor attainment or actual equipment runtime. In the ten-year regional study, median free-cooling opportunity is 342.0 h in Tulsa and 2,577.5 h in Phoenix under the same target program. Those opportunities are not a promise of free indoor control.
Q2What is the binding constraint?
Missed targets, unmet capacity, sensible and latent loads, and their sources. Follow solar, lights, envelope, infiltration, controlled outdoor air, fans and crop moisture through the single-zone balance instead of treating every missed hour as a cooling problem.
Q3Which strategy closes the gap, under which assumptions?
Compare six canonical equipment strategies on common weather and target hours. Inspect weather-year variation, modeled operating cost and sensitivity to selected inputs. The regional study reports unresolved decisions as unresolved. Control classes in CLASSES.md explain topology, not a current measured nine-class performance ladder.
§ 03
How it works
Static browser tool, no account
01Pick a site and weather period
Enter a US ZIP, confirm the centroid and time zone, then retrieve NASA POWER hourly weather, use station observations with independent solar, or import a CSV or JSON snapshot. Tulsa, Phoenix, Miami, Denver, Seattle and Fairbanks each have bundled weather for 2016 to 2025.
02Describe the facility and crop band
Greenhouse, hybrid or indoor. Floor, canopy and envelope areas are separate. Set day and night temperature, VPD, dew-point guardrail, photoperiod and DLI. Review template values as assumptions, not prescriptions.
03Declare the airflow and equipment
Set uncontrolled infiltration separately from minimum and maximum controlled outdoor air. Add pads, heating, dehumidification, cooling, recovery or DOAS treatment as appropriate. Project or manufacturer performance inputs are required where the model has no supported default.
04Run, compare and export
A Web Worker simulates a coupled single-zone balance with one-minute staged control. Attainment comparisons use common eligible hours, excluding each weather segment's warm-up. Exports retain assumptions, price basis, model version and the pinned PsychroLib version.
Site-years bundled
60
Six climates, ten years each, 2016 to 2025
Regional simulations
360
Six strategies × six climates × ten full weather years
Morris simulations
1,872
104 design points; six strategies; three sampled years
Current model
0.3.0
Screening release; scenario schema 2; weather schema 1
Both regenerated study artifacts report zero numerical-failure hours. That is a computational check, not empirical validation. Full executed evidence: VERIFICATION.md.
§ 04
What you get
Output, and the basis under it
Multi-year climate risk
Median, worst, best, spread and trend per strategy, plus operating-cost ranking stability.
BasisHistorical years, not a probability distribution. Interactive across-years stability requires the same order every year; the regional artifact uses its separate 90% rule.
Multi-site comparison
The same facility, crop and strategies across sites, so weather changes without silently changing installed capacity.
BasisThe committed regional study holds capacities and manual prices constant. Its costs are not local equipment quotes or local tariffs.
Pad opportunity and runtime
Separate hours when the weather makes a pad useful from hours when the controller actually runs it.
BasisWeather-side classifications and equipment dispatch are different measures. Neither alone establishes joint indoor attainment.
Outdoor-air drying screen
Compare outside-air moisture removal with mechanical dehumidification on cost per kilogram and energy per kilogram.
BasisA conditional screening comparison with declared fan, conditioning and price inputs, not a universal operating instruction.
Sensible and latent loads
Hourly and monthly source decomposition, with heat losses below the axis and space sensible heat ratio alongside moisture load.
BasisOne controlled outdoor-air stream in the balance. Infiltration is separate; recovery and DOAS do not add another stream.
Enrichment-compatible hours
See when controlled ventilation stays at its minimum, rather than assuming the facility is always closed.
BasisA dispatch-based opportunity indicator. CO2 enrichment feedback on transpiration and internal circulation are not modeled.
Air-treatment accounting
Inspect actual outdoor airflow, recovery core and bypass flow, treatment energy, condensate and unmet conditioning.
BasisInstalled ACH capacity is not actual hourly flow. Recovery transfer is not purchased energy or an automatic savings claim.
Design-basis brief
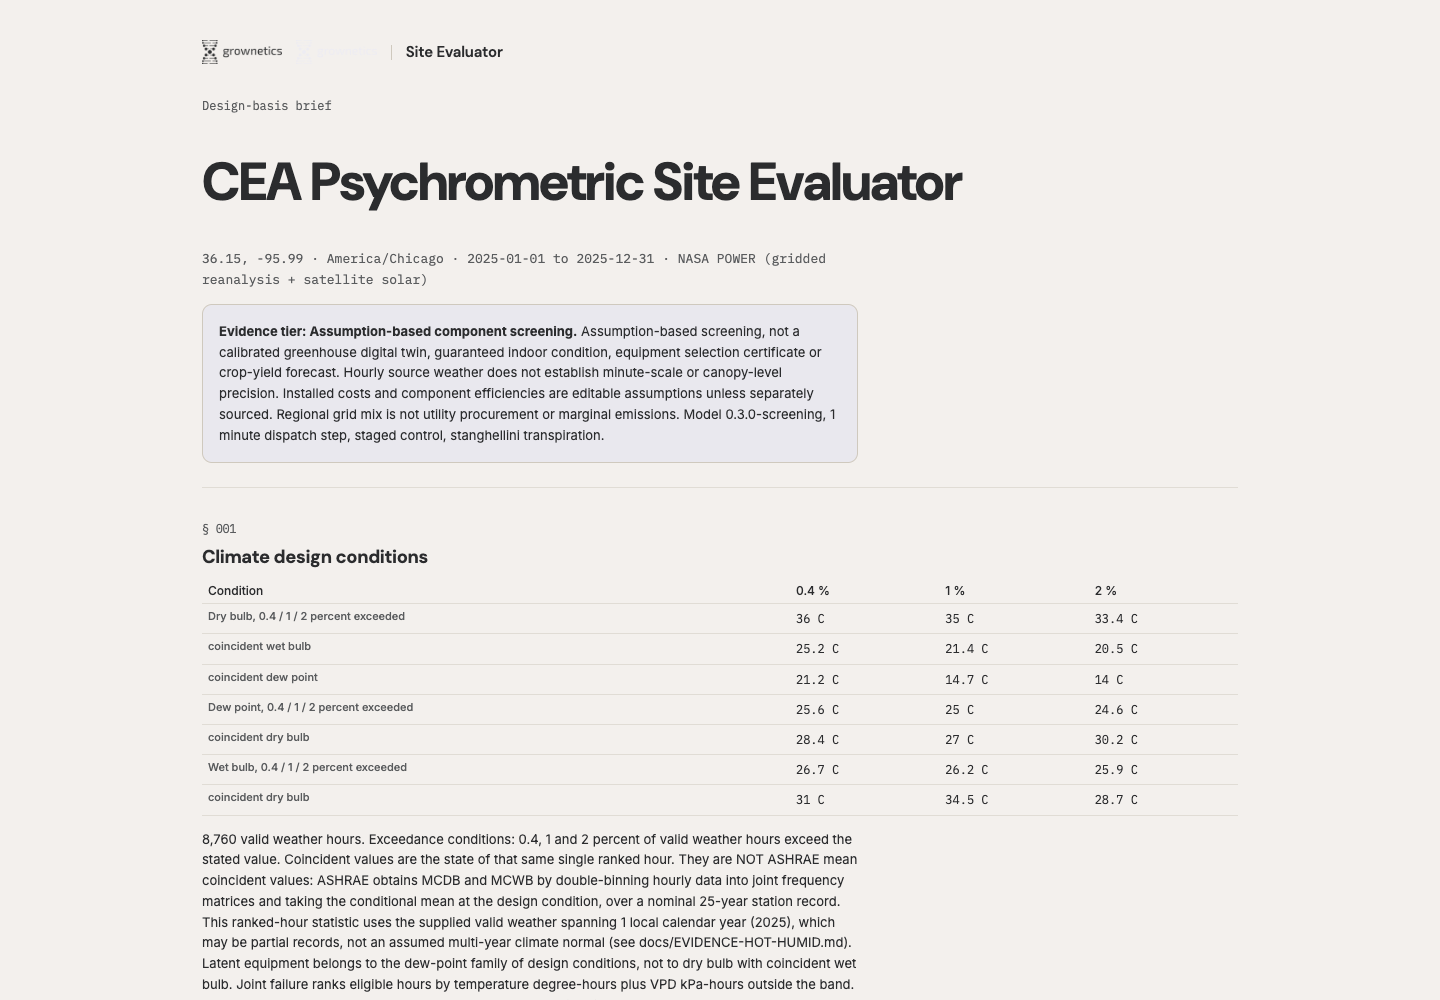
Export coincident weather conditions, loads, air requirements, water, target attainment and evidence limits for engineering review.
BasisA printable Grownetics Archive document, not a stamped design or equipment selection certificate.
§ 05
Evidence and honesty
Tier 2 of 4
The evidence ladder in EVALUATION.md. This tool is an assumption-based equipment screen.
| Tier | Inputs and checks | Permitted output | Not established |
|---|
| Weather feasibility | Traceable outside state, psychrometrics and target bands | Air-side cooling, drying and pad windows | Indoor conditions, energy cost or ROI |
| Assumption-based equipment screen | Declared envelope, crop, airflow and finite equipment. This tool. | Conditional zone trajectories, target hours, energy and costs | Calibrated prediction or manufacturer guarantee |
| Benchmarked simulation | Matched independent model and published measured cases | Documented errors for covered conditions | General accuracy outside the benchmark domain |
| Site-calibrated analysis | Held-out facility climate, energy and condensate data | Project-specific predictive performance with uncertainty | Guaranteed yield, life safety or spatial precision |
Read costs and percentage points with their populations
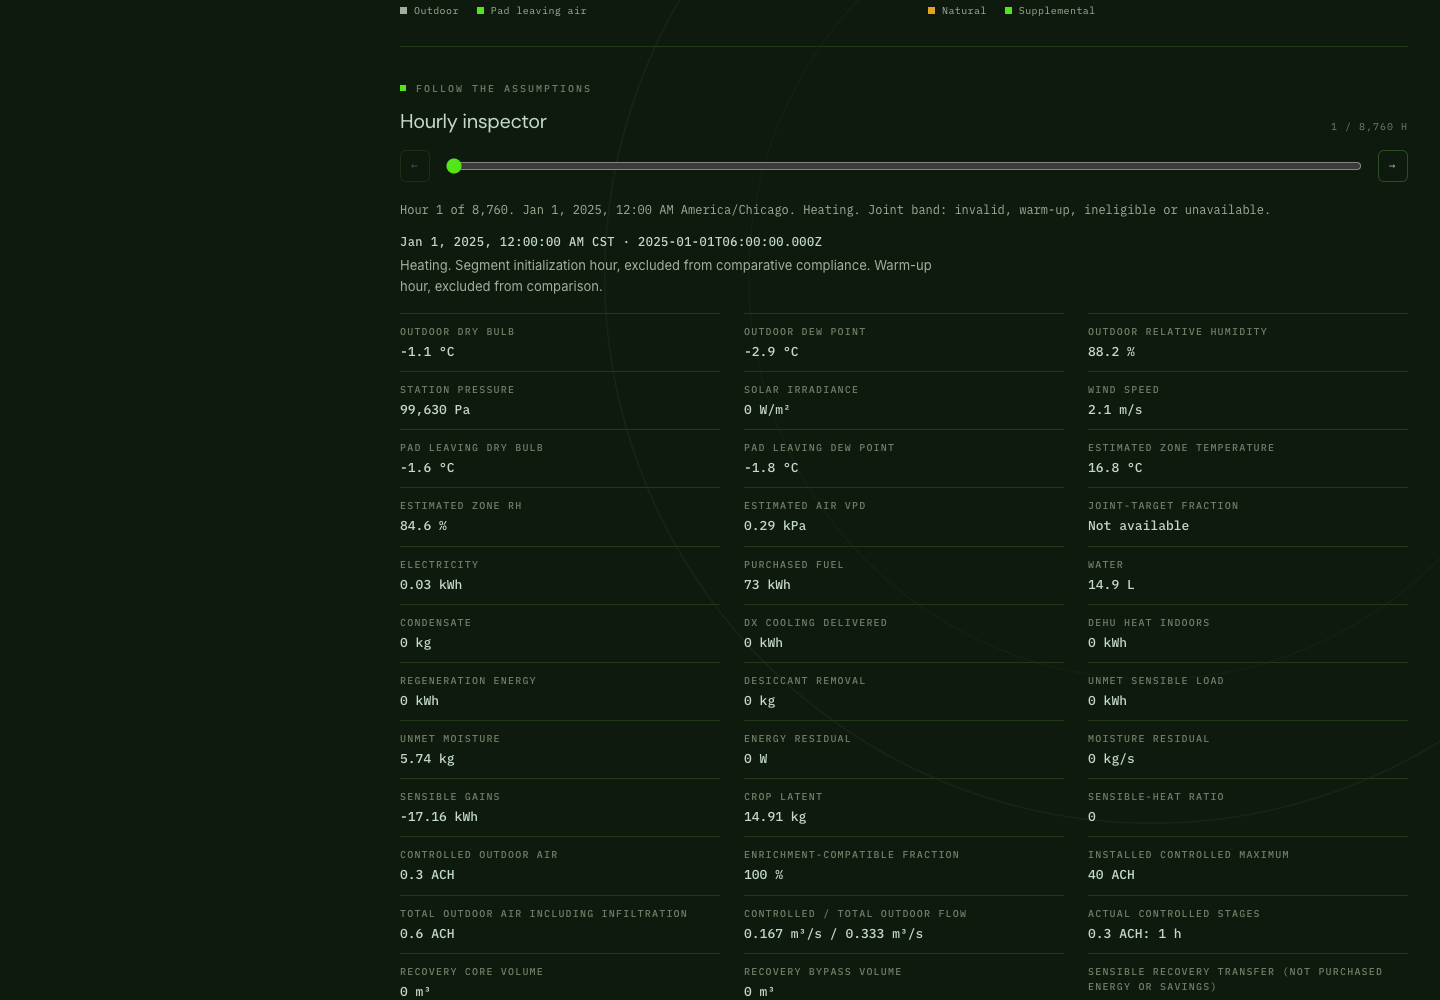
The current browser example uses Tulsa calendar 2025 and the six canonical scenarios. Each strategy has 8,760 valid hours, 8,759 eligible hours, one warm-up hour, and zero missing or numerical-failure hours.
Model 0.3.0-screening, Tulsa 2025. Joint temperature-and-moisture attainment uses eligible hours. Both dollar columns are model-estimated operating costs, not installed prices.
| Strategy | Joint attainment | Annual operating cost
8,760 valid h | Matched operating cost
8,759 eligible h |
|---|
| Pad + vent baseline | 27.135% | $22,064.29 | $22,060.97 |
| Pads + condensing dehumidifier | 41.638% | $28,493.30 | $28,489.98 |
| DX / mini-split + dehumidifier | 73.066% | $39,915.37 | $39,912.06 |
| Integrated HVAC + reheat | 55.297% | $47,201.10 | $47,196.78 |
| Desiccant + evaporative cooling | 51.875% | $33,827.30 | $33,823.78 |
| Liquid-desiccant hybrid (generic) | 52.619% | $47,332.88 | $47,328.69 |
Cost basis. Purchased electricity, purchased heating fuel and scenario water at manual prices of $0.12/kWh, $0.045/kWh and $0.002/L. Annual totals include valid warm-up consumption; matched totals exclude it. Installed capital is separate. These operating costs exclude maintenance, labor, financing, taxes, demand charges, fixed charges, time-of-use effects and other unmodeled tariff components. Differences are not quotes or guaranteed savings.
Pad baseline to DX/dehumidifier changes joint attainment from 27.135% to 73.066%: +45.931 percentage points (pp) on the same eligible population, not a 45.931% relative improvement. The regional study instead reports medians of full weather-record costs over ten years. The Morris study reports sampled-period costs, not annual totals.
Source: genuine current browser-run export, browser-run-metrics.json. Inputs: example-scenarios.json.
What changed in airflow and air treatment
One controlled outdoor-air stream. ACH means air changes per hour. Infiltration is uncontrolled exchange; minimum and maximum ventilation ACH bound controlled outdoor air. Recovery and DOAS treat that stream, not additional ventilation. Internal recirculation is outside this model.
HRV/ERV performance and frost behavior require declared inputs. Above the supported recovery flow range, excess air bypasses the core and mixes once. Core heat or moisture transfer is not purchased energy.
DOAS now accounts for sensible and latent cooling through enthalpy and COP, plus reheat and available heating capacity. Unmet conditioning remains visible. The former $39,517 DOAS result and derived reductions are withdrawn because sensible conditioning energy was omitted. Old class rankings and hybrid close-up savings are not current evidence.
A modeled 6 ACH capacity is not a recommendation. A 15 ACH constrained semi-closed case is not conventional open-greenhouse capacity. Project airflow still needs engineering review.
What the sensitivity screen supports
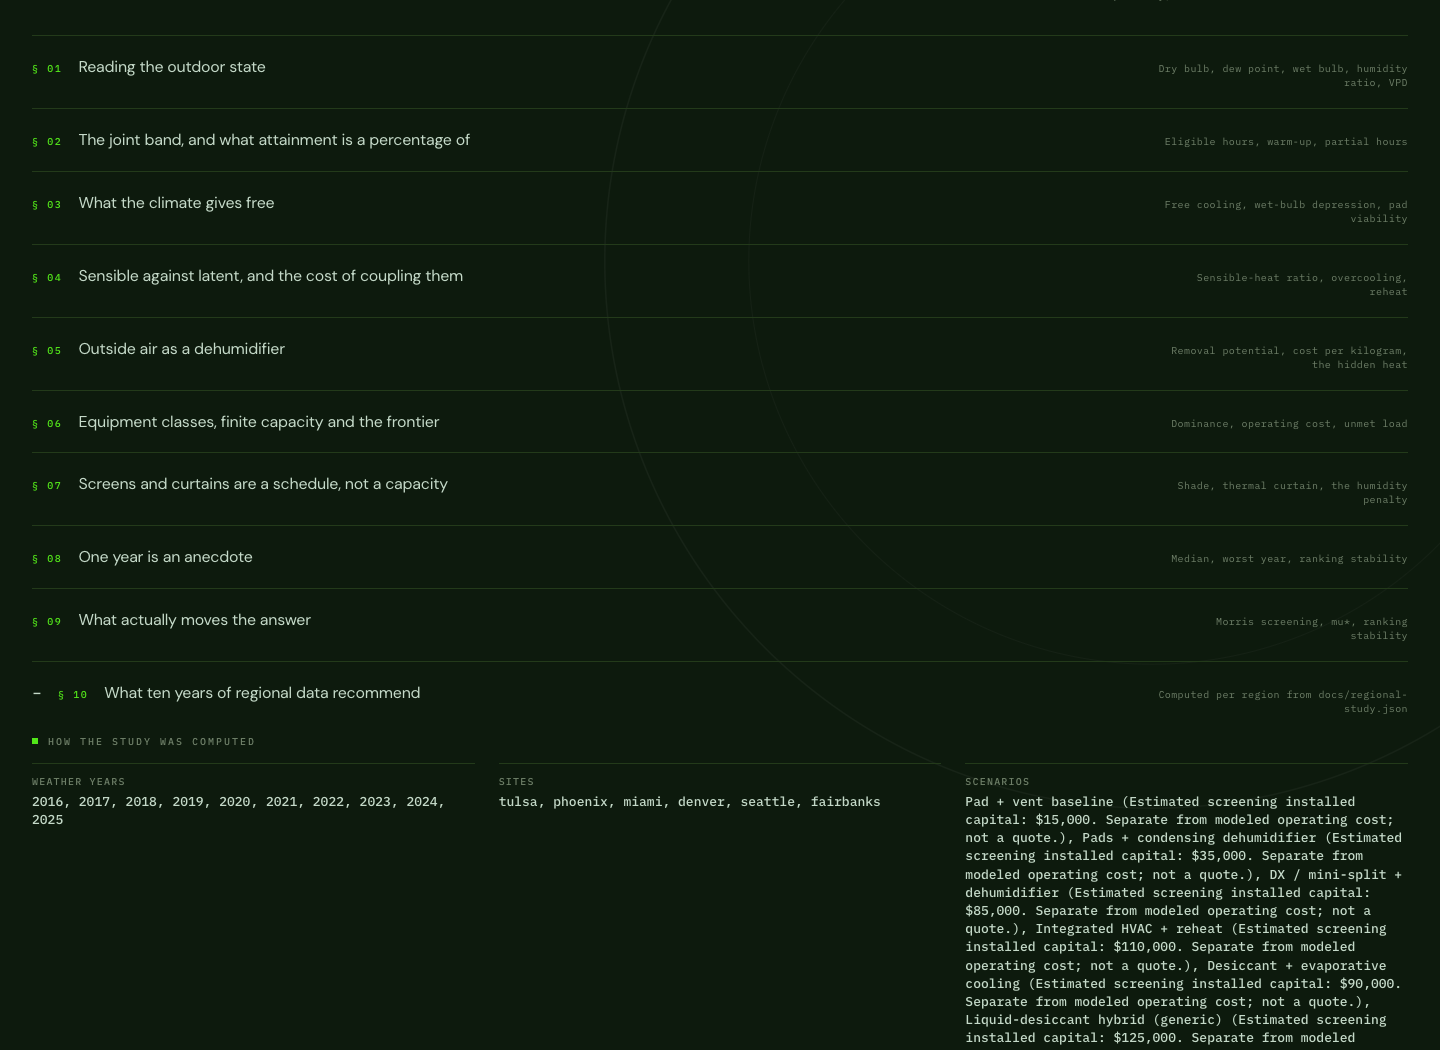
The regenerated Morris screen has 104 design points, eight trajectories and twelve parameters. It runs six strategies over sampled days in three Tulsa years: 1,872 simulations, not 1,872 full-year simulations.
LAI/transpiration leads aggregate joint-attainment influence at 9.098627 pp per full screened parameter range. Maximum controlled outdoor-air capacity has 2.164460 pp influence. These are mean absolute normalized elementary effects (mu*), not a single before/after pair or a confidence interval.
Three complete operating-cost orders occur; the most common holds 61.5385% of design points. The full ranking is unstable under these ranges. The regional 5 pp capability tier and 16% cost band are retained methodological rules, not newly calibrated uncertainty thresholds.
What this is not
- Not a calibrated digital twin. No measured-site calibration has been performed.
- Not independently benchmarked against another greenhouse model.
- Not equipment sizing, a tonnage schedule or stamped mechanical design.
- Not a manufacturer comparison. Generic equipment assumptions are not product performance maps.
- Not a yield, revenue or ROI forecast. Added control hours are not crop value.
- Not a weather forecast. Historical years are not probabilities for the next year.
- Not an exact site locator. ZIP centroids are not facility locations; utility candidates are not tariffs.
- Not spatial. A well-mixed zone cannot establish canopy-to-canopy precision.
- Not proof of present-release cadence convergence. Older step-refinement checks remain historical development evidence.
Read the caveats with the numbers. Conservation and numerical checks do not establish real-world accuracy. Close rankings still need measured loads, equipment maps, capital and maintenance comparisons, and a project-specific engineering review.
The repository's graded hot-humid literature review found no Grade A head-to-head evidence within its reviewed scope. That is a bounded literature finding, not proof that no such study exists. The current outputs remain modeled screening results.
Read the records: verification, dated audit, Morris sensitivity, regional evidence, and component parameters.
§ 07
Roadmap
Each claim needs evidenceThe implemented screen is not the end of the accuracy work. DIGITAL-TWIN.md records the route to equipment maps, independent benchmarking and held-out site calibration. Historical milestone evidence must not be read as fresh verification of model 0.3.0.
| Area | Current status | What the evidence permits |
|---|
| Site evaluator | Implemented | Weather-year and site comparisons, load decomposition, Learn, portable runs and design-basis exports. |
| Staged controller | Implemented | Finite-capacity causal dispatch. Older cadence studies are historical; discrete airflow ladders remain resolution-limited. |
| State-coupled crop | Implemented | Stanghellini transpiration responds to radiation and zone state, under declared canopy assumptions. |
| Structural sensitivity | Regenerated, 0.3.0 | Morris influence and ranking stability over selected ranges, not quantified probability or calibration. |
| Airflow and conditioning | Corrected, 0.3.0 | One-stream recovery/DOAS accounting, source-capacity limits and explicit cost populations. Old savings claims withdrawn. |
| Equipment maps | Planned | Manufacturer-map-based screening only where supported maps and operating domains are supplied. |
| Independent benchmark | Planned | Documented model-to-model and measured-case errors for the covered conditions. |
| Site calibration | Planned | Project-specific predictive performance only after identifiable calibration and held-out validation. |
Tool documentation: PRD, architecture, energy data, research, evaluation scheme, control classes and limits.
Open the toolRead the source and docs